Index tuning recommendations
In closed beta.
Indexes are the single biggest lever you have over query
performance in PostgreSQL, and one of the easiest to get wrong, especially
as your database usage evolves.
Picking the right ones usually means stitching together
pg_stat_statements, pg_stat_user_indexes, pg_stats, bloat estimates,
and a fair amount of judgment.
DBtune does that work for you, against your real workload.
Notably, we differ from other index tuning services, in that you do not need any additional extensions beyond pg_stat_statements enabled on your database. All index analysis and recommendations are offloaded to a statistical snapshot of your database, analyzing query plans using the native PostgreSQL planner and HypoPG to ensure we find the best indices for your running workload.
We surface the following with no extra queries run against your database:
- New index suggestions, concrete and ranked by how much they would speed up real queries you have actually run, with ready-to-paste DDL.
- Health checks on the indexes you already have, so you can spot the ones that are unused, redundant, bloated, or otherwise not earning their keep.
Both update continuously, so the picture reflects what your database is doing now, not what it was doing when the schema was designed.
DBtune does not apply index recommendations automatically. You stay in control: review each suggestion, decide whether it fits, and run the DDL yourself. Any future automation around this will be strictly opt-in.
What you see in the platform
Index tuning lives on the Indices tab of each database. The page has two modes you can switch between:
- Recommendations: new indexes DBtune is suggesting you create, ranked by estimated speedup.
- Existing indexes: every index already on the database, each with its own health check.
Selecting an item on the left opens a detail panel on the right. A "Request a scan now" button lets you trigger an immediate re-analysis instead of waiting for the next daily refresh.
Recommendations
Not every query is worth optimizing.
Before generating recommendations, DBtune ranks the queries running against your database by the total time the database spends on them (total_exec_time from pg_stat_statements, i.e. average runtime × number of calls), and focuses on the ones that actually move the needle.
A 200 ms query that runs ten thousand times an hour matters more than a 30-second query that runs once a day, and the recommendations reflect that.
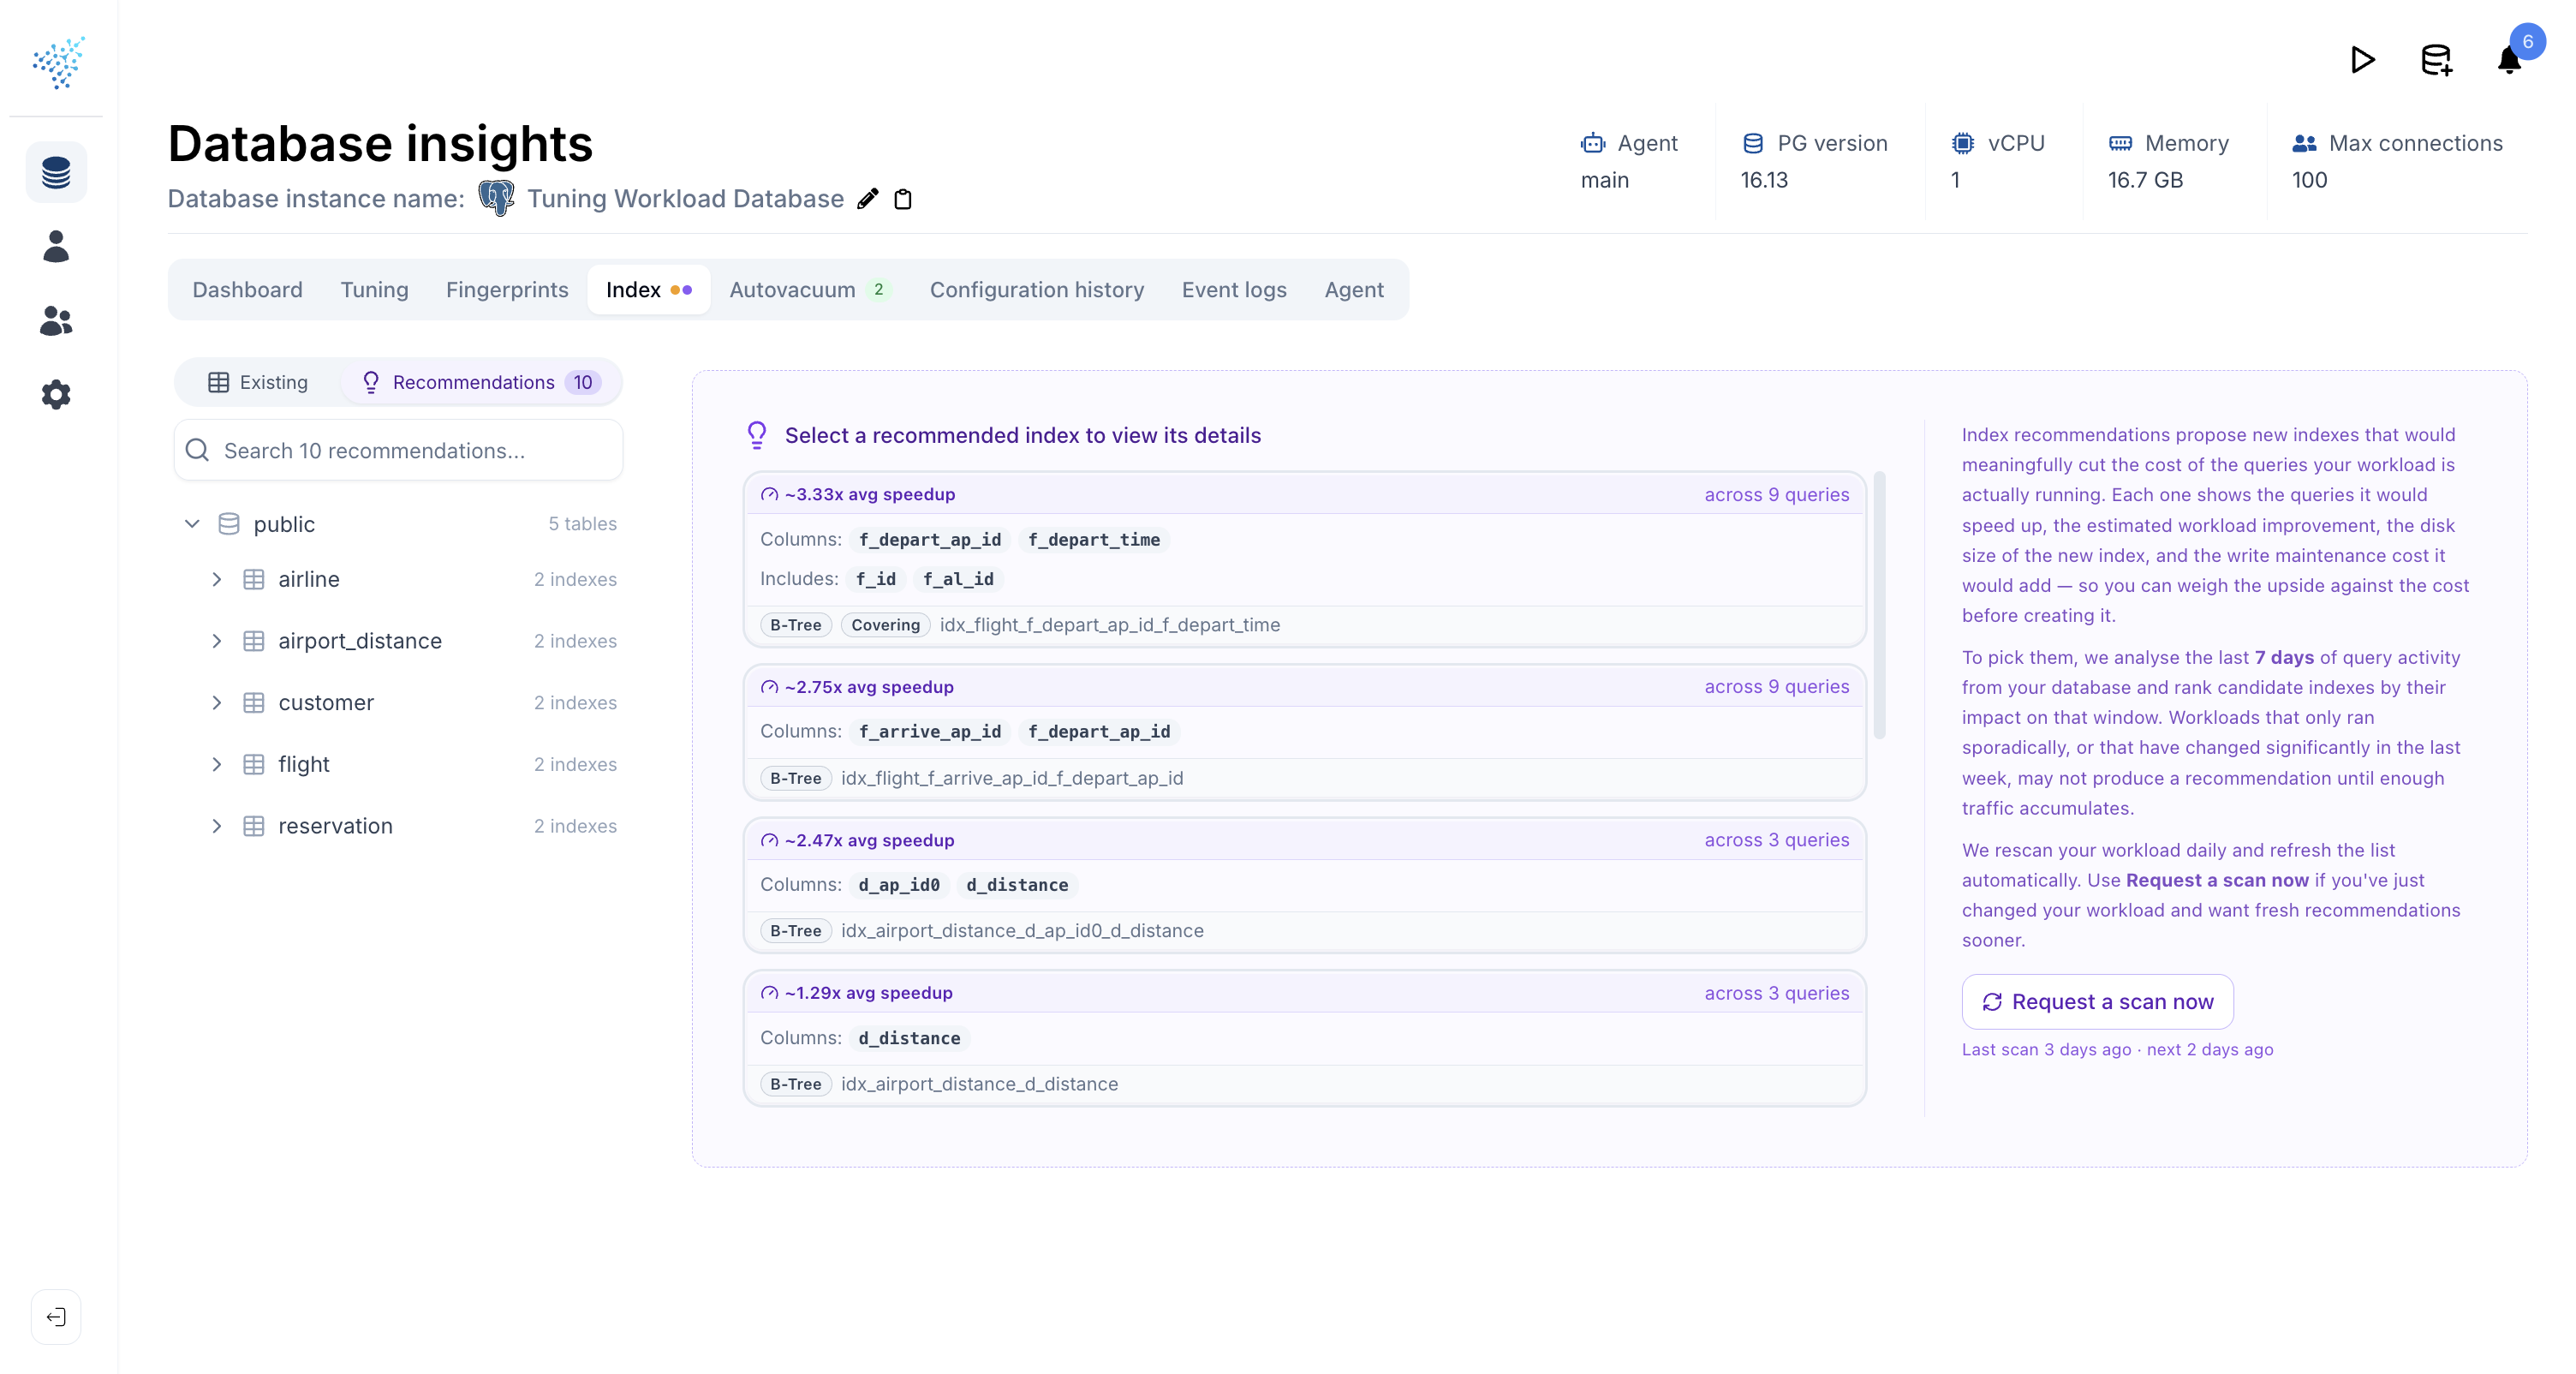
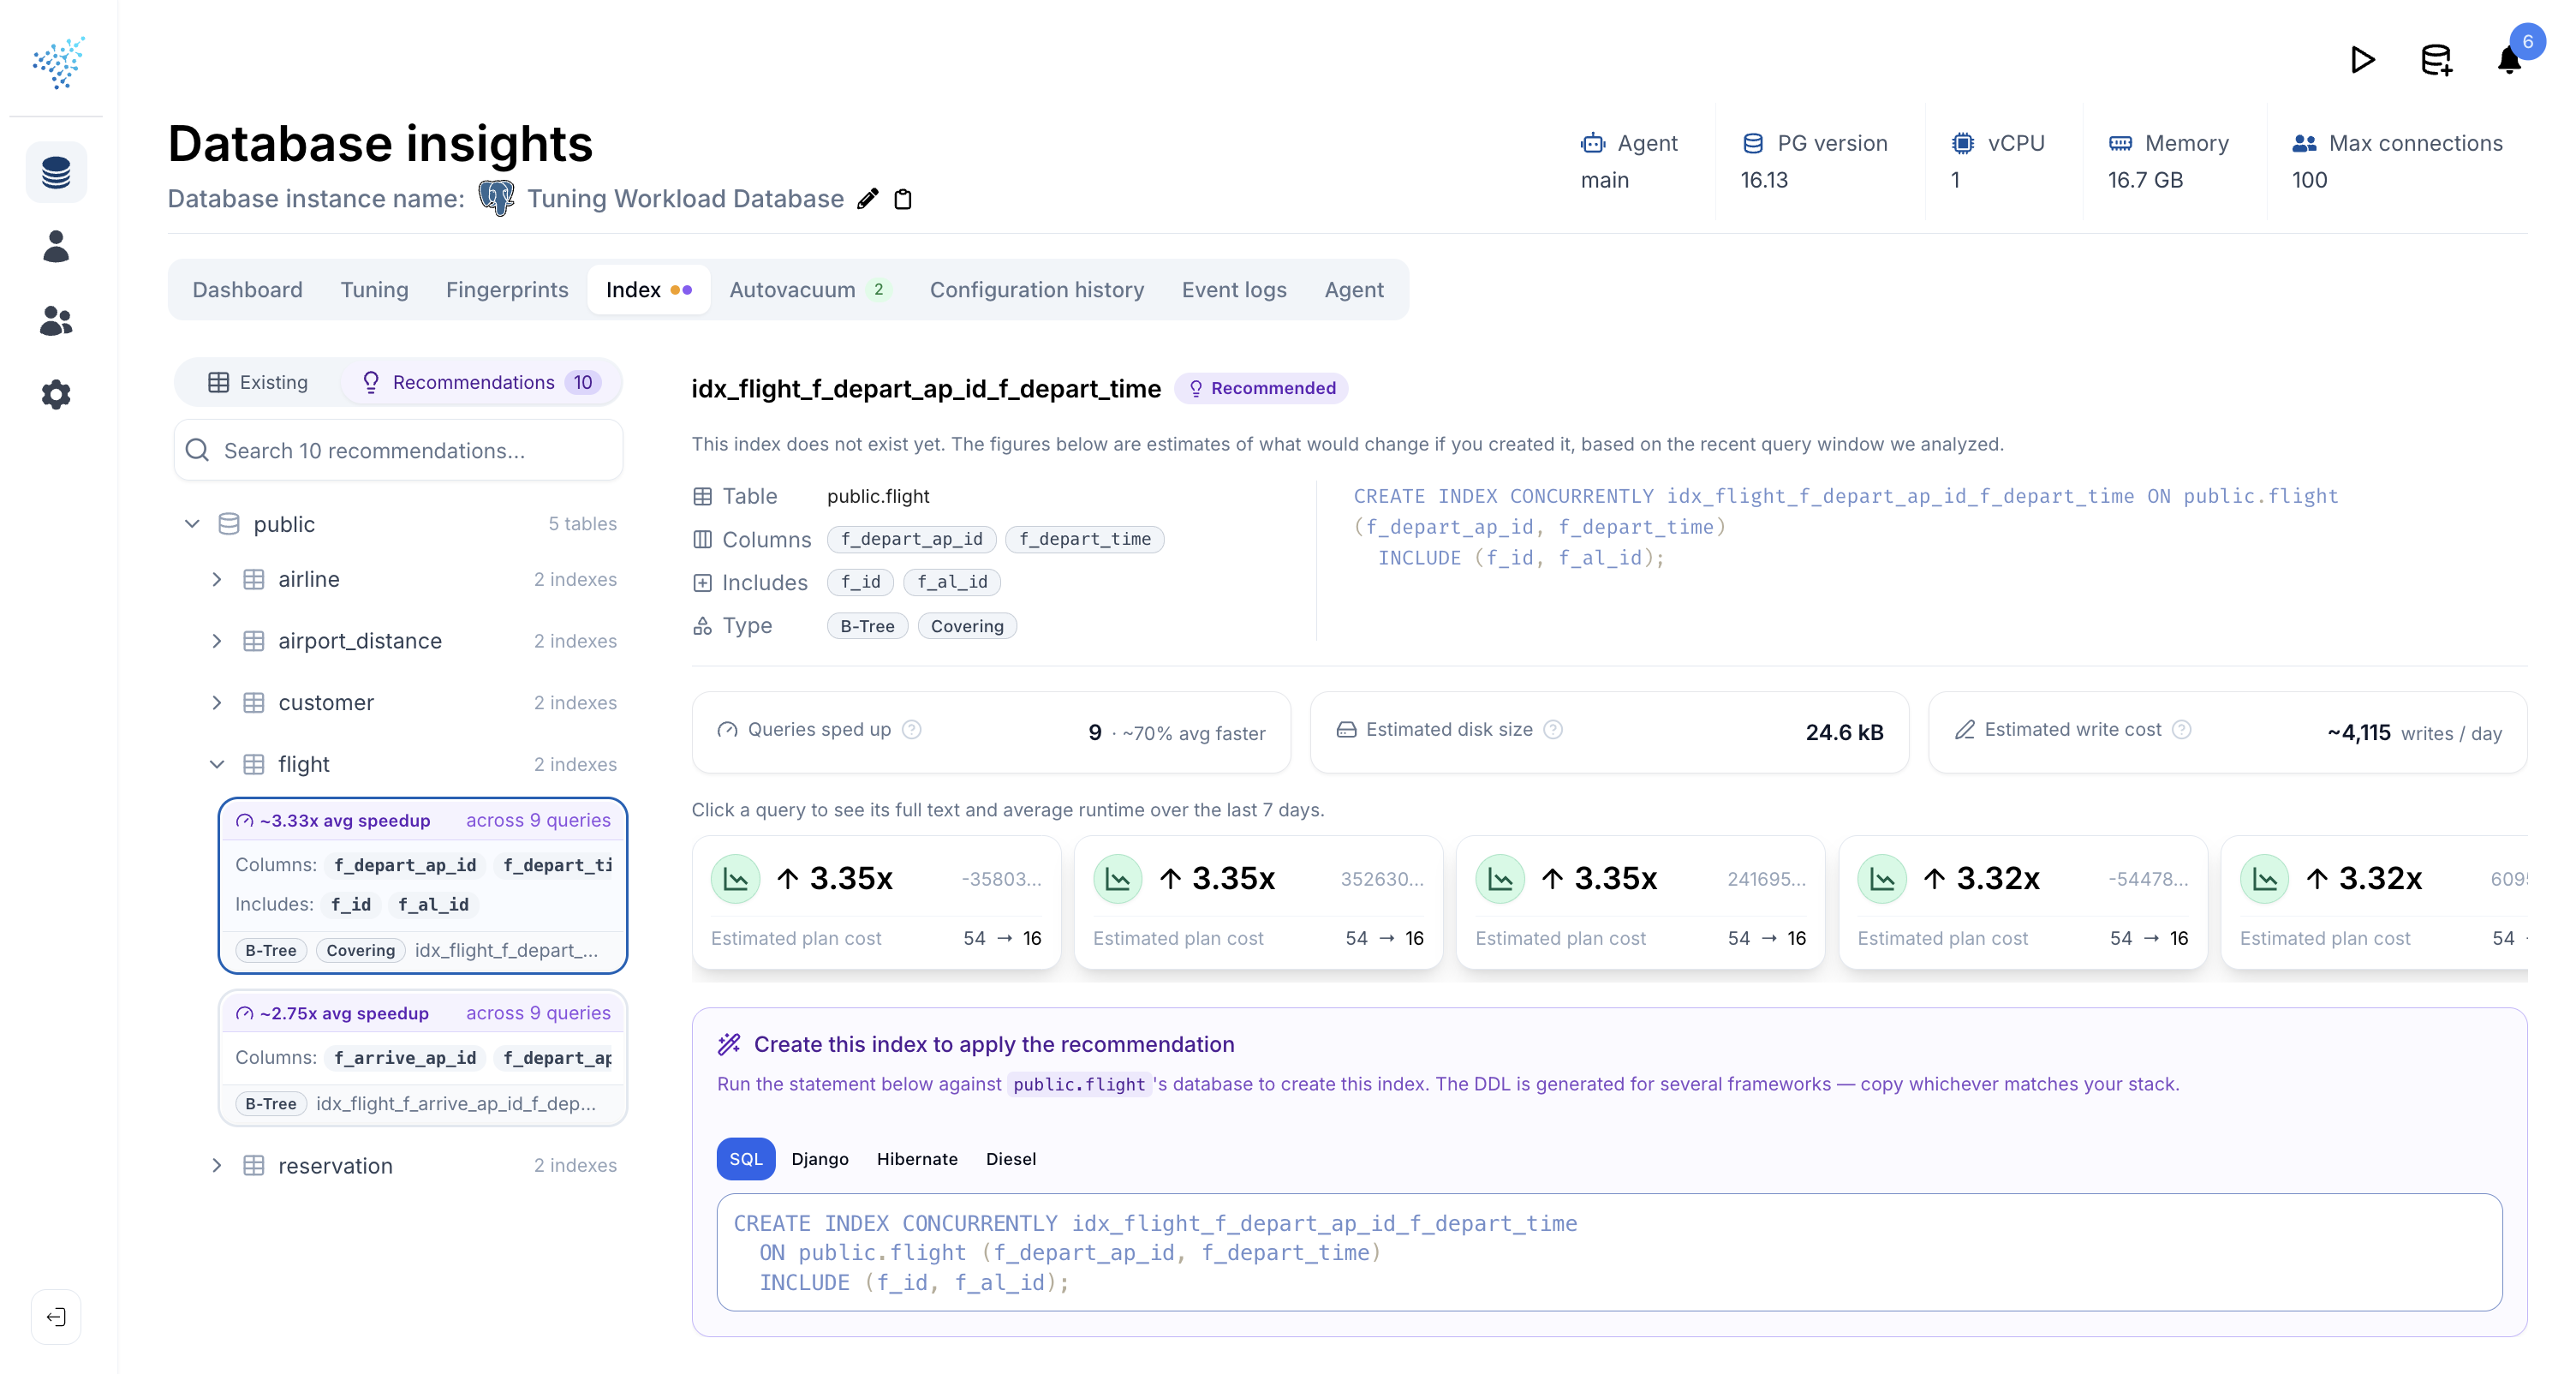
Each recommendation card shows the headline benefit up front: average query speedup and the number of queries it affects. Open one and you get:
- The columns,
INCLUDEcolumns, and anyWHEREclause that make up the suggested index. - Estimated disk size and estimated write cost per day, so you can weigh the cost against the speedup before you commit.
- The list of queries the index would help, each with the cost reduction the planner expects. Click a query to see its actual runtime over the last 7 days.
- The raw SQL and ORM specific templates to incorporate this index into your code. Pick the one that fits your migration tooling.
Recommendations are ranked by speedup, so the most impactful suggestions are always at the top.
Reported speedups may not exactly match what you observe in production, for a few reasons:
- Stale statistics: recommendations are based on snapshots of
reltuplesandpg_statstaken at generation time, not the live values. - Use of
EXPLAIN (GENERIC_PLAN): to protect your data we only see parameterized queries frompg_stat_statements, so we plan them withEXPLAIN (GENERIC_PLAN). This matches what most prepared statements do, but conditional plans may deviate. - Missing histogram values: statistics such as
pg_stats.most_common_valshelp the planner but can contain sensitive data (e.g. user emails), so we do not collect them by default. You can opt in for better recommendations by enablinginclude_table_datafor thepg_statscollector in our agent.
Existing indexes
The Existing indexes view groups every index in the database into three buckets so you can see at a glance where attention is needed and what is already healthy:
- Attention: something is likely wrong and worth acting on (e.g. a long-unused index, a redundant index, severe bloat).
- Informational: worth being aware of, not necessarily worth acting on (e.g. an early signal that scan rate is declining).
- Healthy: checks that passed, listed explicitly so you know what was actually verified rather than just absent.
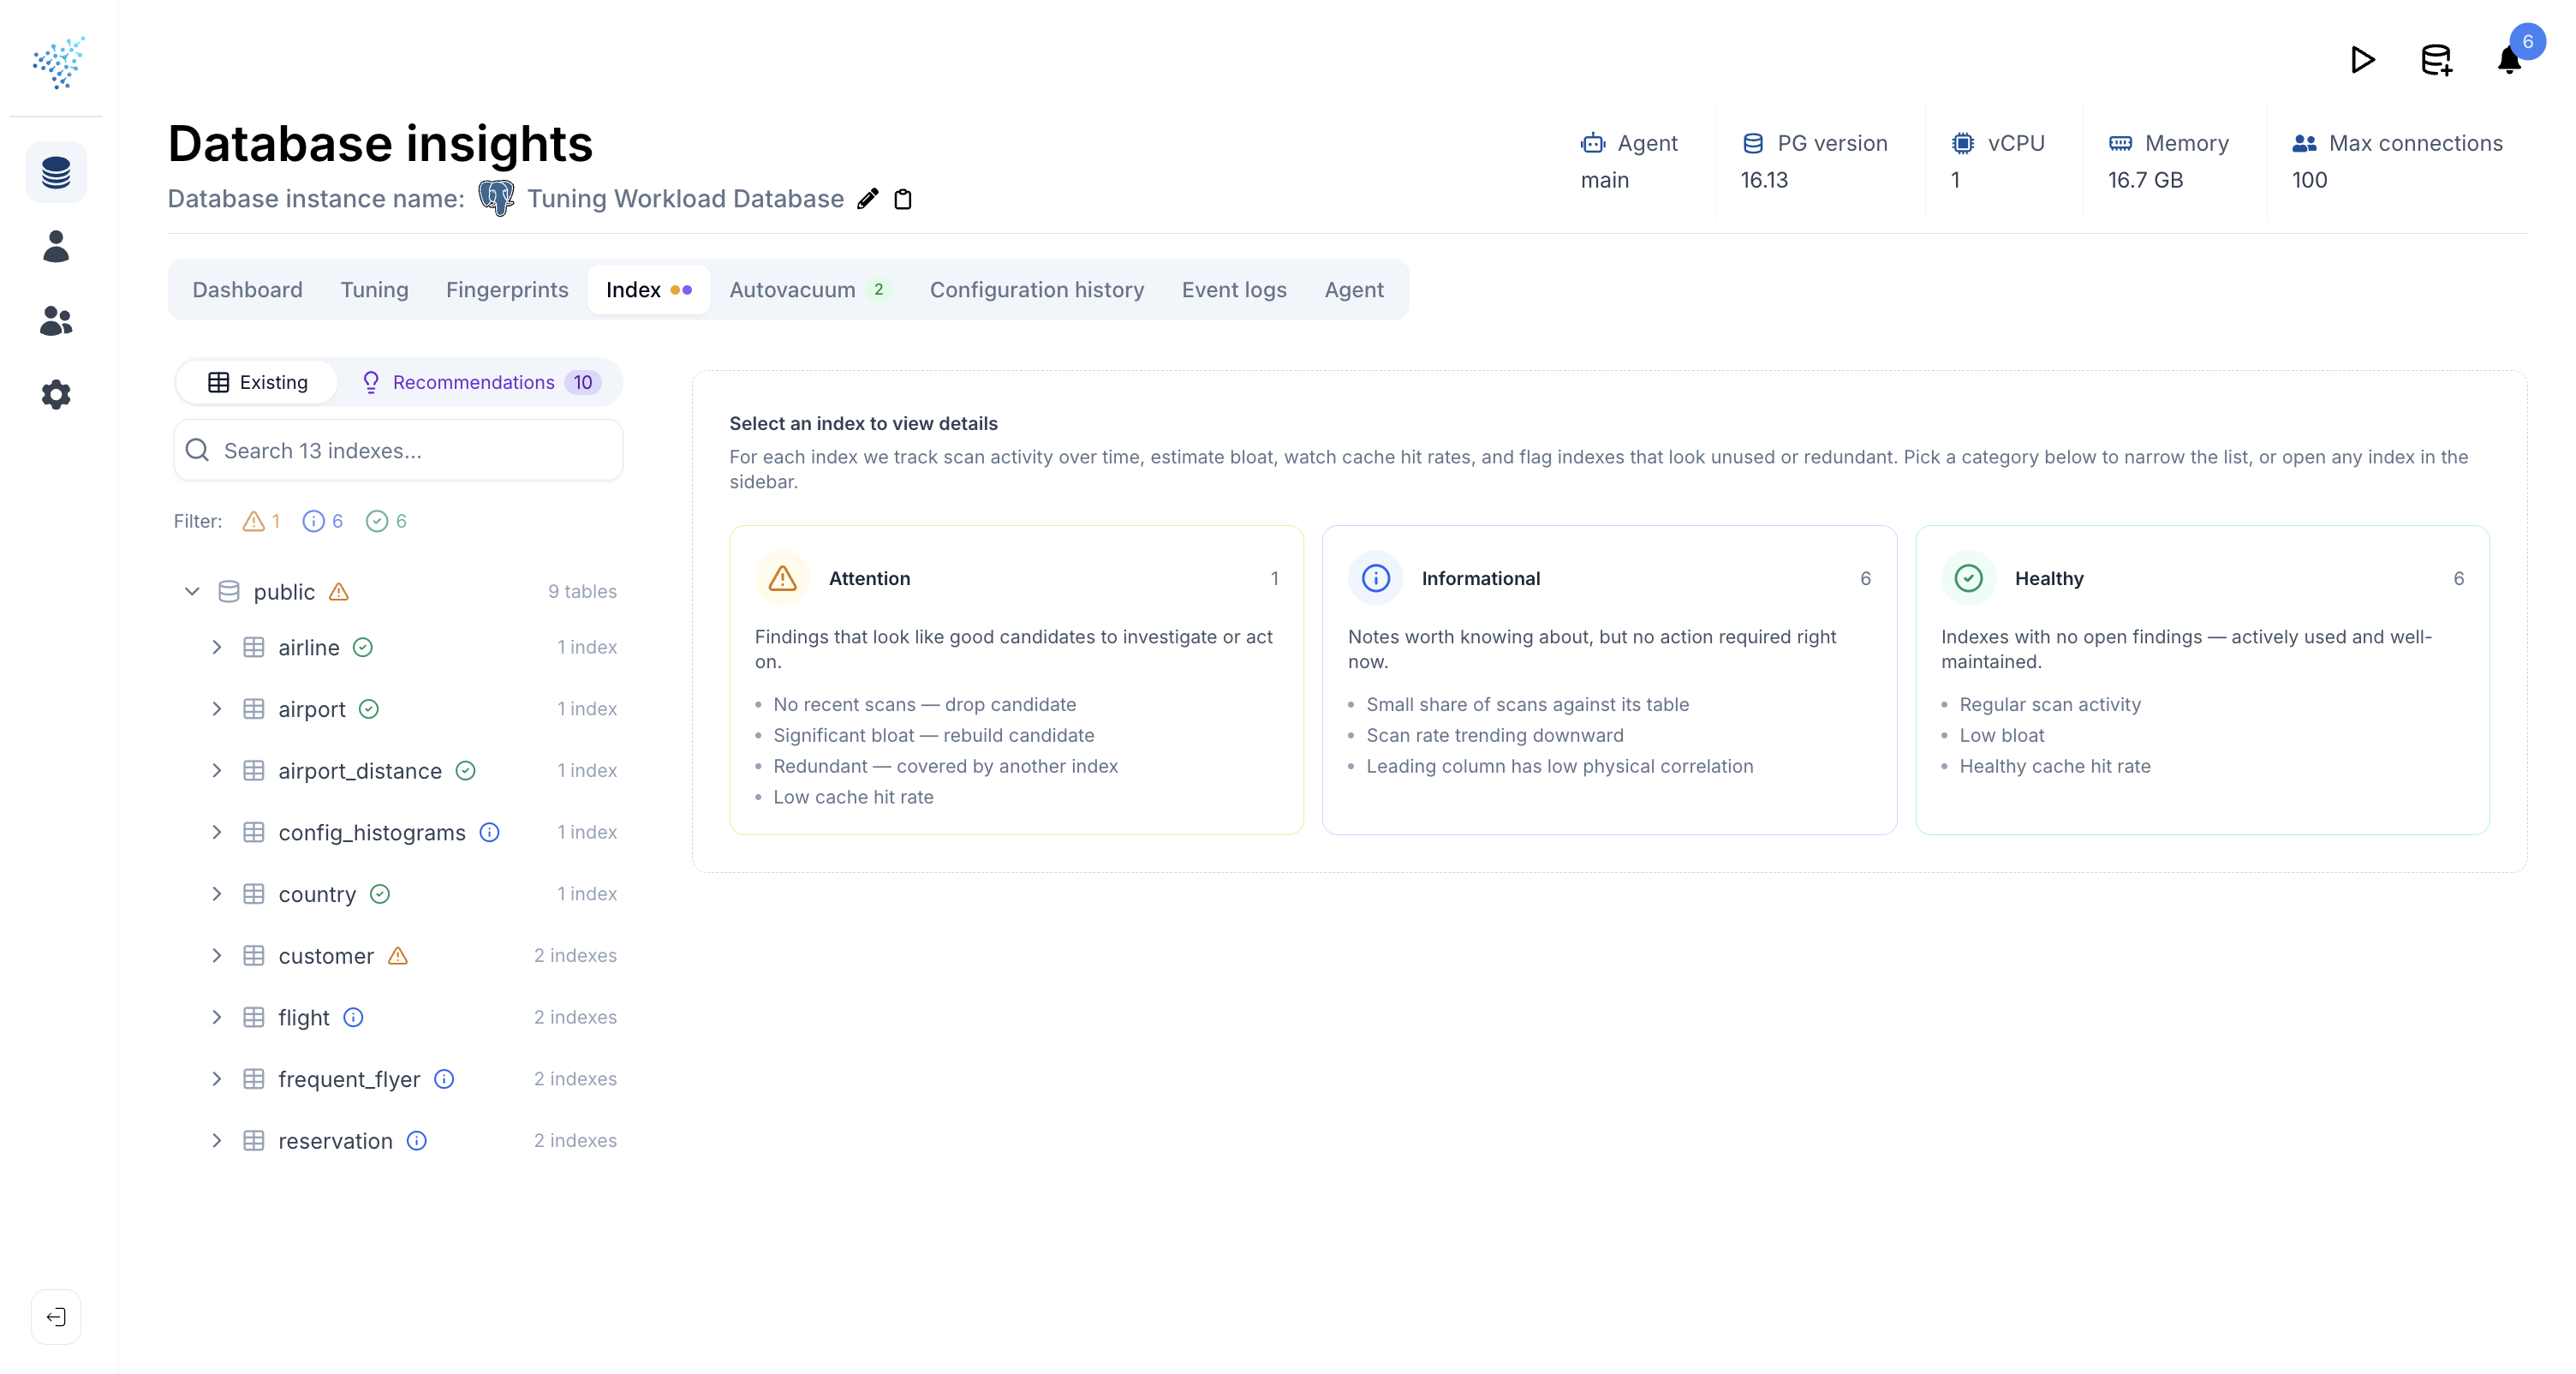
You can filter the index list by finding type, so questions like "show me everything that has bloat" or "show me indexes nobody uses" are one click.
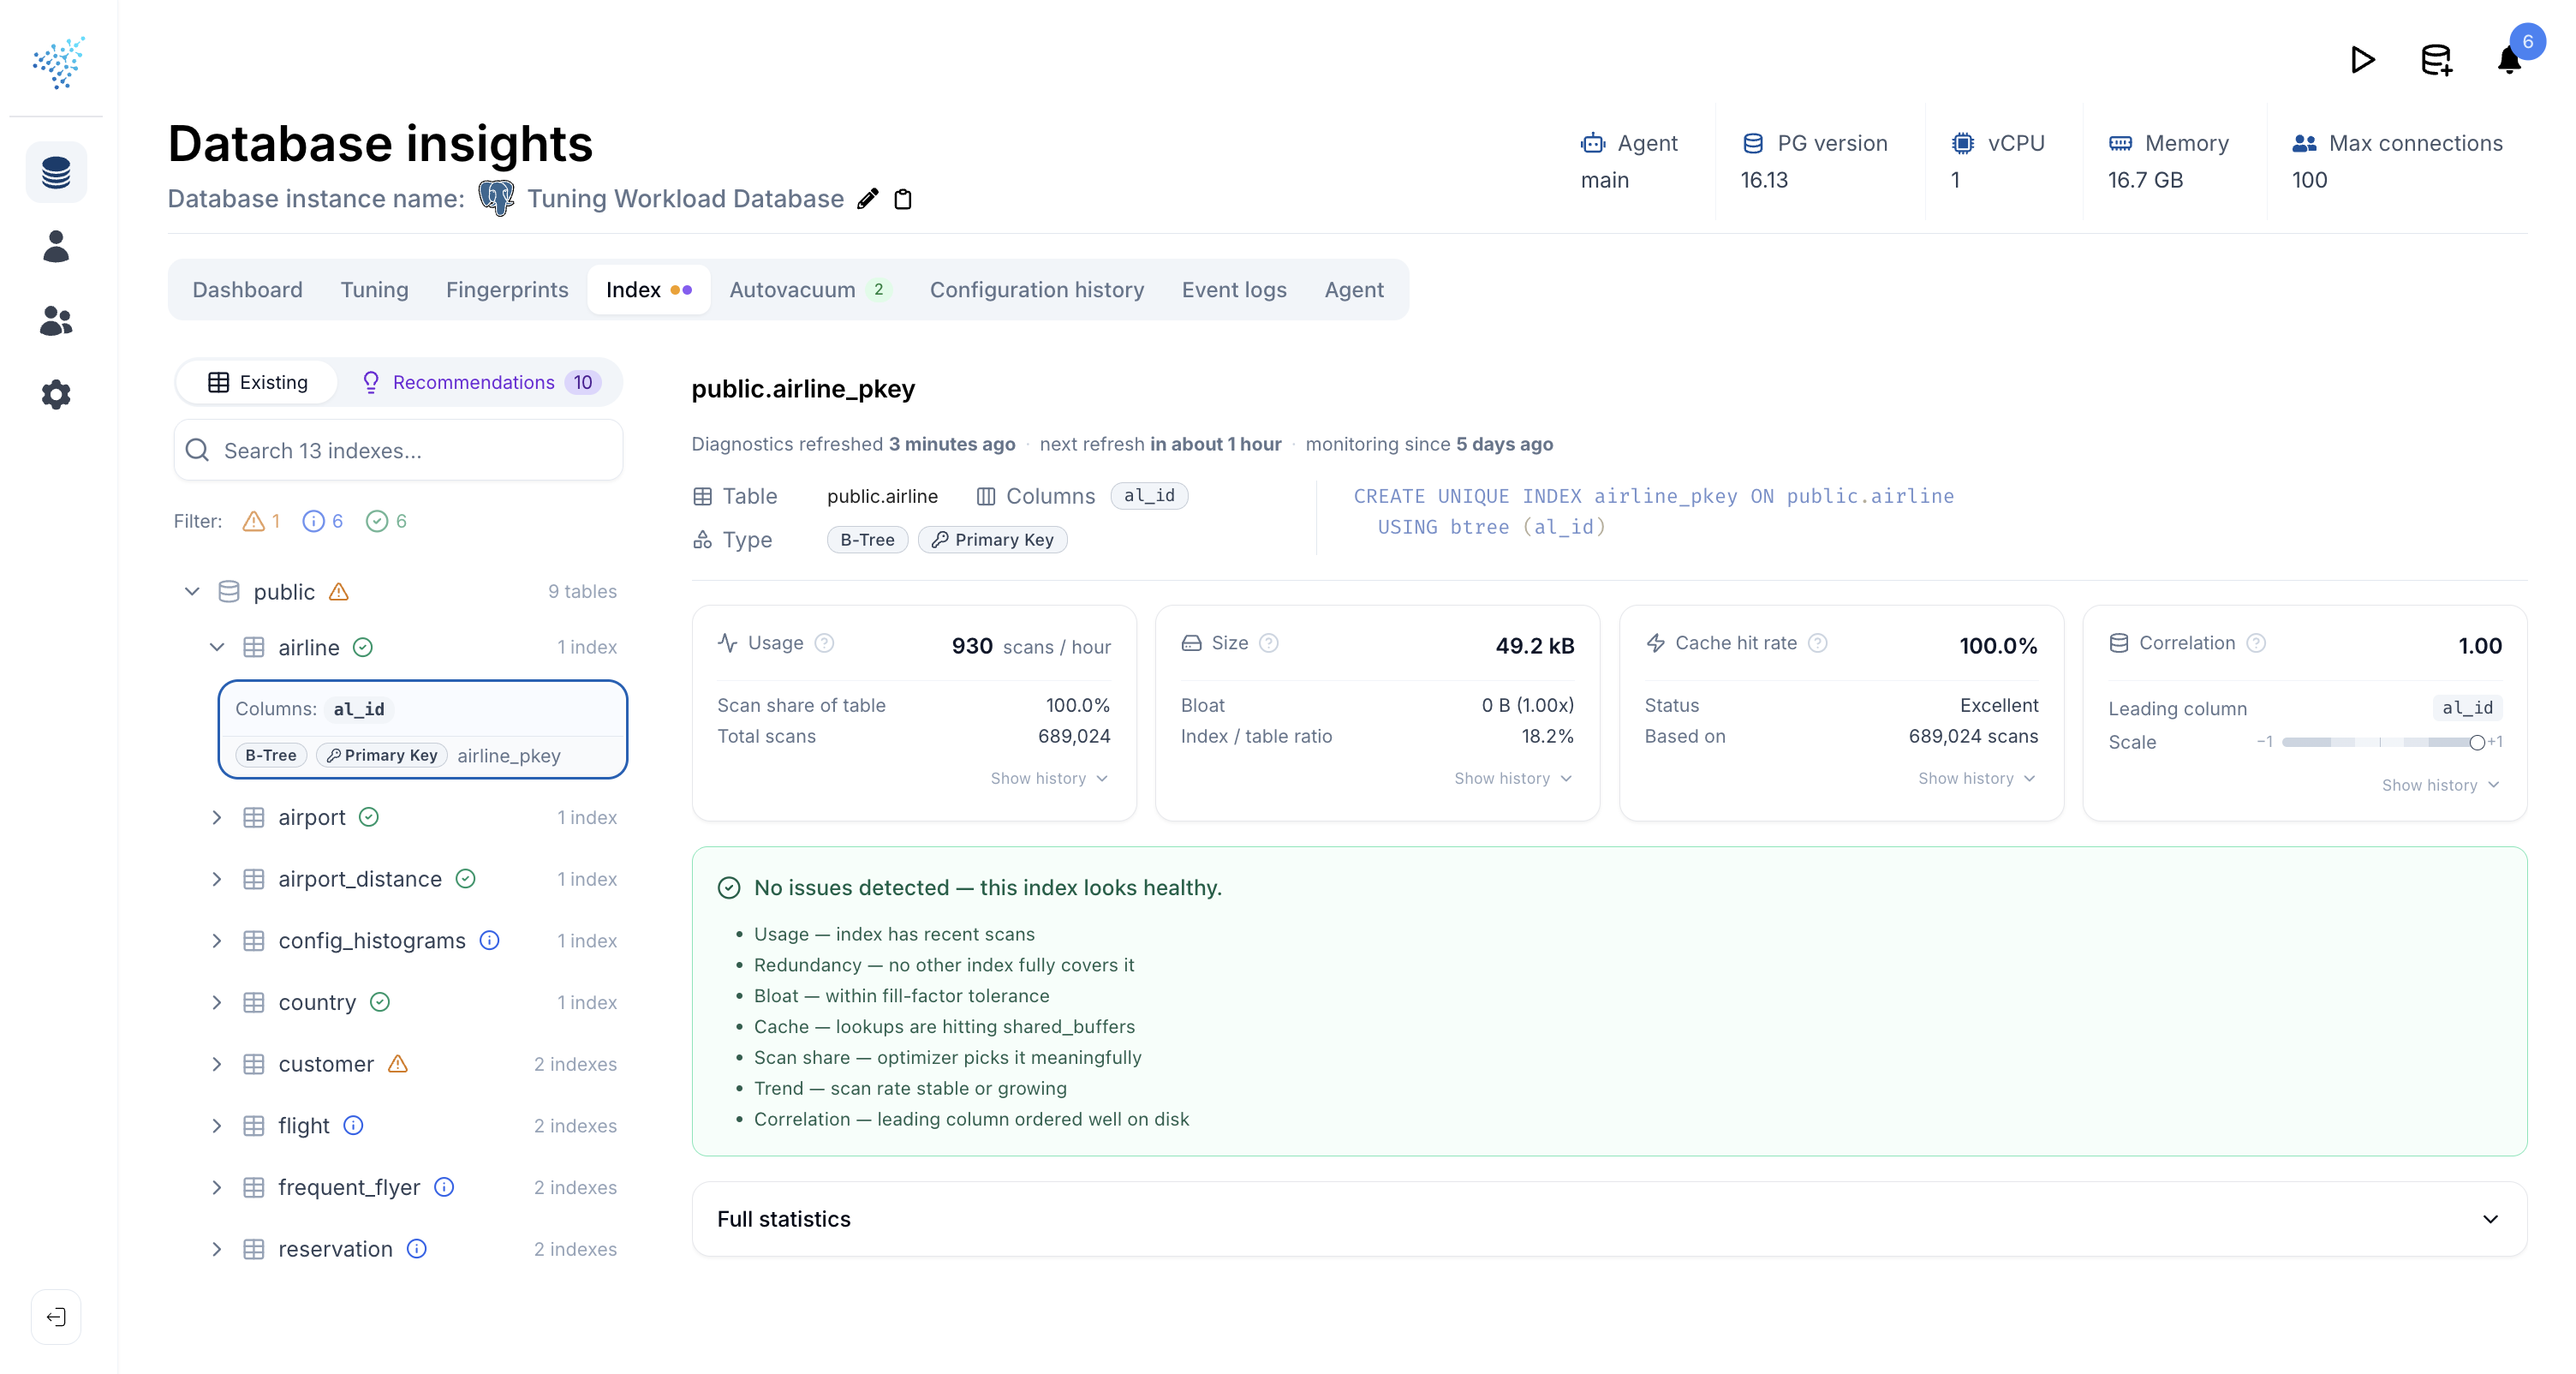
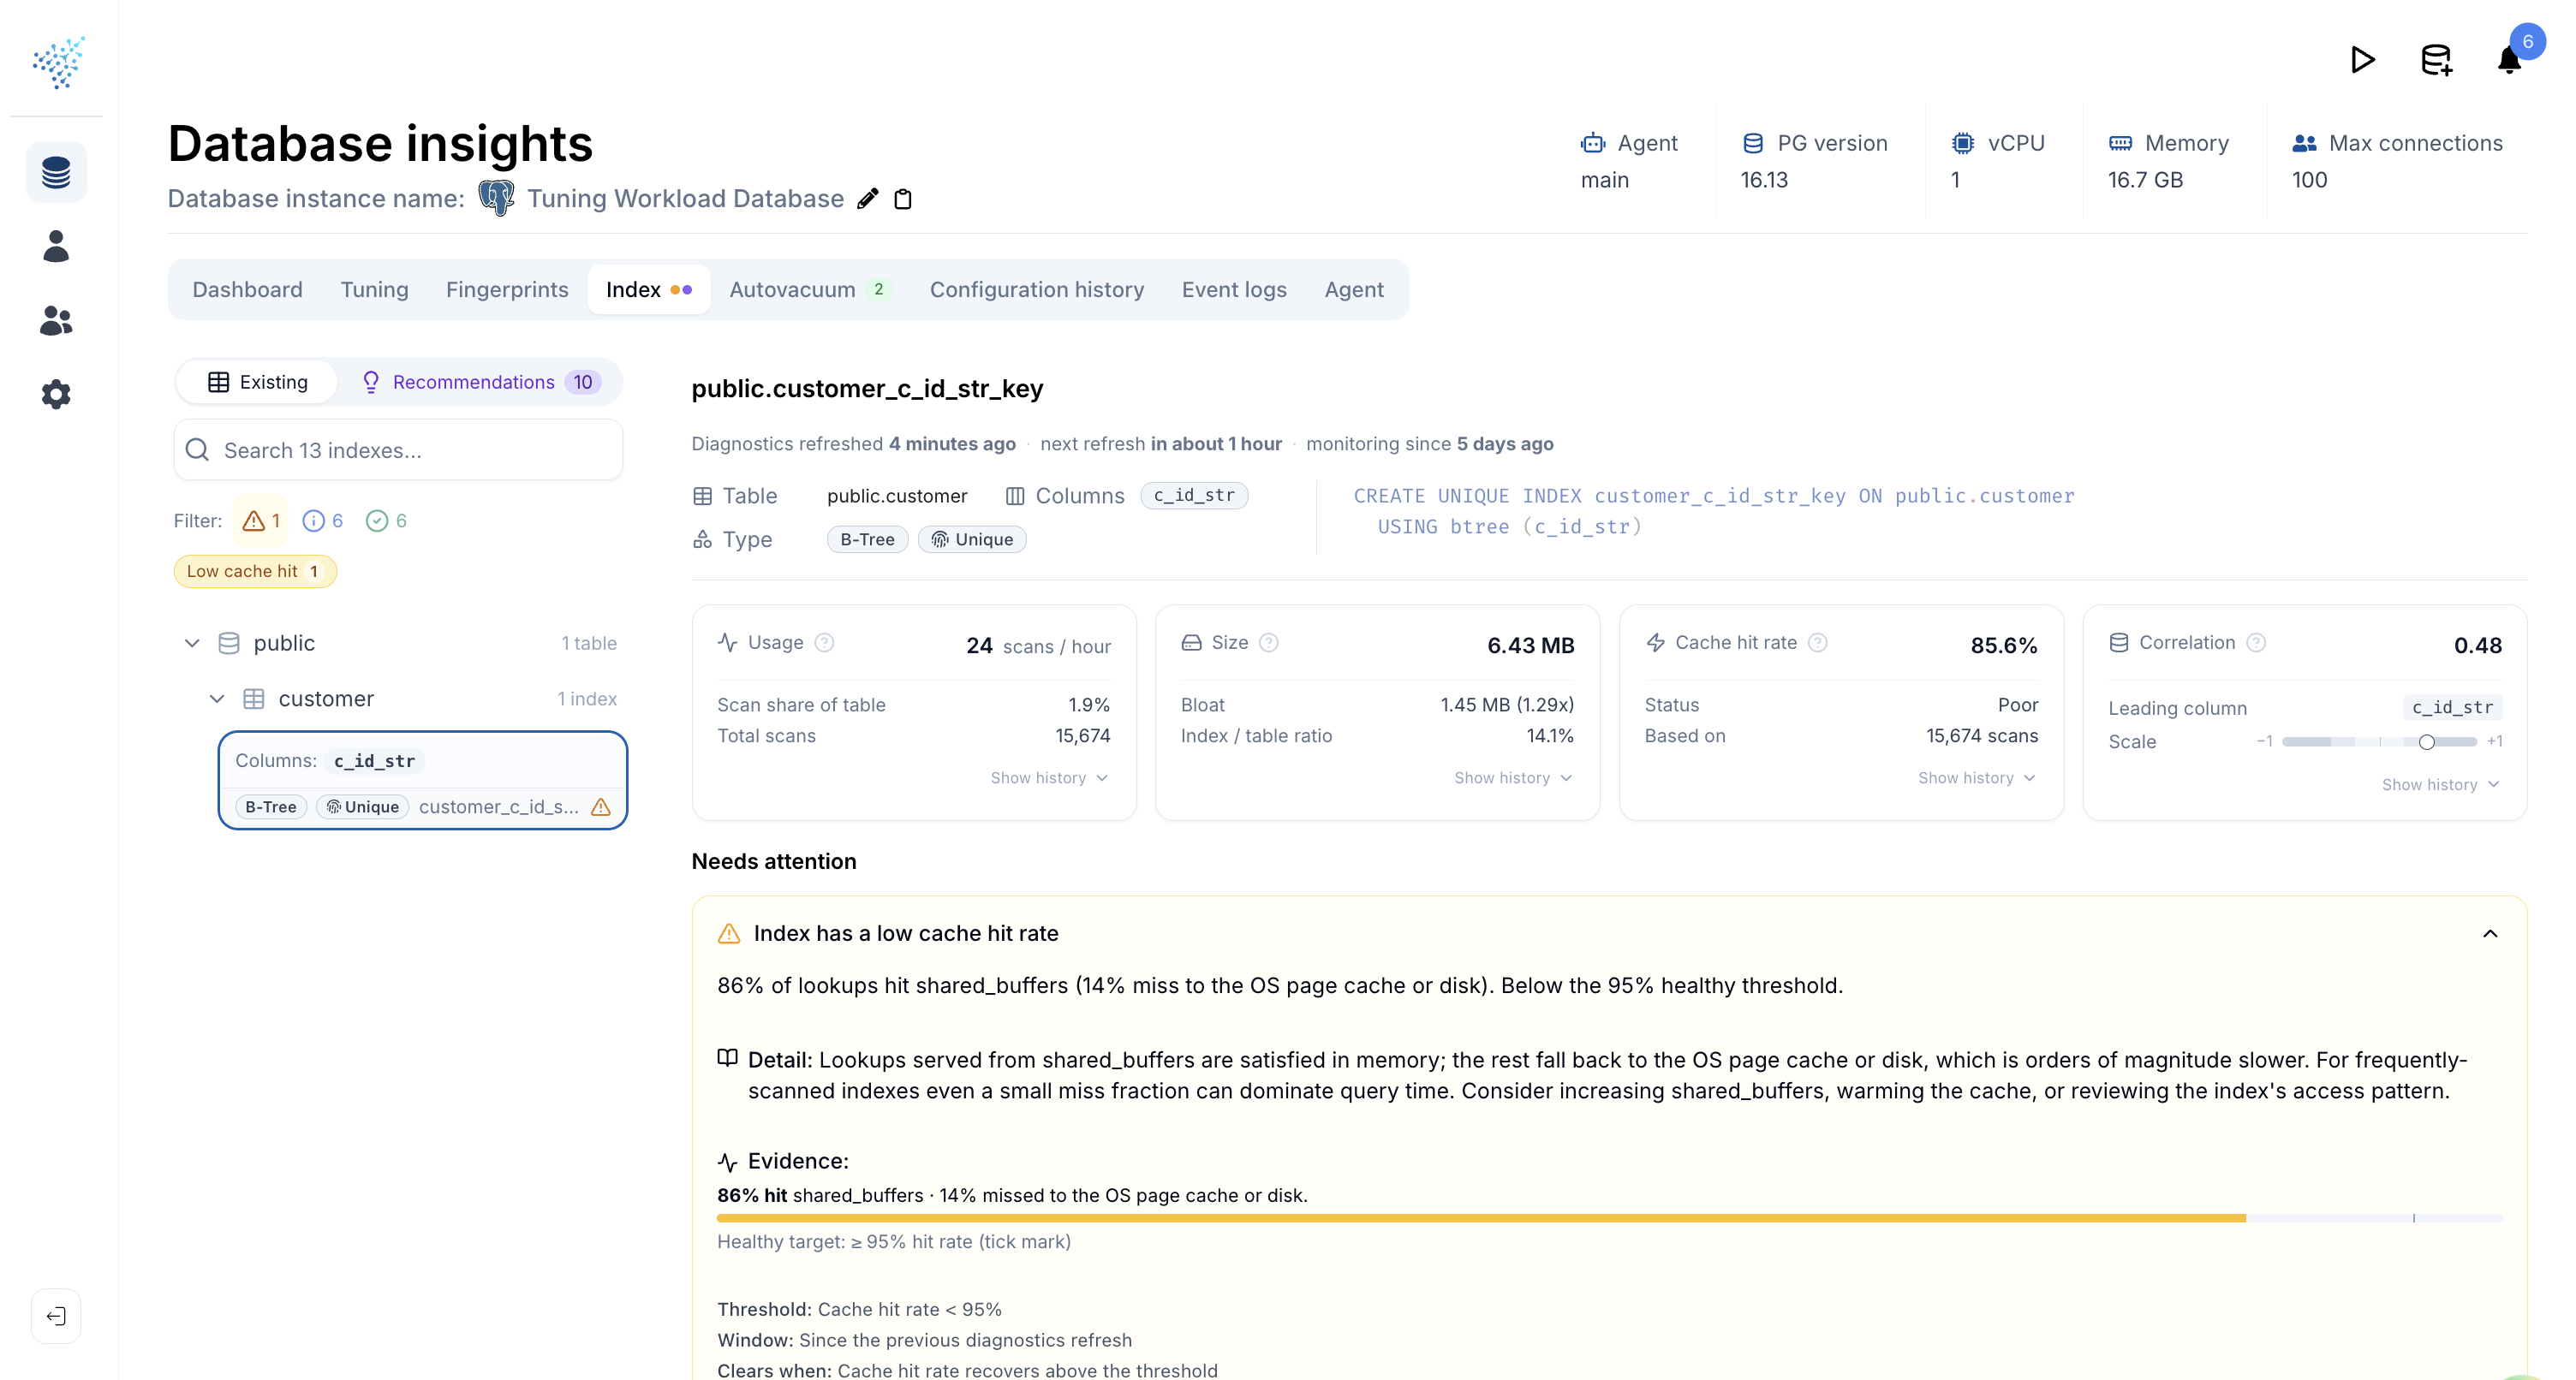
Open any index and you get an at-a-glance dashboard of how it is actually being used:
- Usage: scans per hour, share of table scans this index serves, total scans observed.
- Size: on-disk bytes, bloat bytes and ratio (smaller is better), and the index's size relative to its table.
- Cache hit rate: percentage of reads served from the buffer cache, with a quick label (Excellent / Good / Fair / Poor).
- Correlation: how well the leading column's order matches the heap's physical order, on a -1 to +1 scale.
Each card has a sparkline you can expand into a full historical chart, so trends are visible alongside the latest number. When everything checks out, DBtune tells you so explicitly rather than leaving you to guess from an empty page.
When a finding fires, you get the full picture inline: a plain-English summary, the supporting evidence (numbers, ratios, charts), and the threshold used. You can judge whether the call fits your workload before acting on it.
Index types
DBtune recommends multiple types of indexes. The right shape depends on the predicate, the data type, and how the query is written. Here are the index types DBtune may propose, and the situations in which each is the right tool.
Create
Single-column B-tree
A B-tree on one column. Generated for any column that appears in equality predicates, range predicates, or ORDER BY keys. An additional ordered variant (e.g. col DESC) is suggested when the sort direction is non-default.
Why use this?
The default index type, and the right answer most of the time. Speeds up equality lookups (col = ?) and range scans (col > ?, BETWEEN, etc.) on one column, and lets the planner read rows already sorted by that column without an extra sort step.
Composite (multi-column) B-tree
Multiple columns combined into one index. Column order follows the equality, range, sort heuristic, with multiple width and ordering variants considered for each query.
Why use this?
When a query filters on several columns at once, a single composite index is usually faster than combining two single-column indexes: the planner walks straight to the matching rows instead of intersecting two index scans. Column order matters: only a leading prefix of the index can be used, so the equality, range, sort ordering ensures the most selective filters come first.
Partial index
An index with a WHERE clause derived from predicates seen in the workload, so the index only covers the relevant subset of rows.
Why use this?
If your queries always restrict to a small slice of the table (e.g. WHERE status = 'active', or WHERE deleted_at IS NULL), a partial index over just that slice is dramatically smaller than a full index. Smaller means faster lookups, less write overhead on every INSERT / UPDATE, and less storage.
Covering index (INCLUDE)
Extra non-key columns added via INCLUDE so the planner can satisfy queries from index-only scans without heap fetches.
Why use this?
A normal index lookup finds the right rows but still has to visit the heap to read the columns you actually SELECT. With INCLUDE columns, those values live in the index itself, so the planner can answer the query entirely from the index: an index-only scan. Worth it when a query reads a few extra columns alongside its filter keys.
Expression index
An index on a function call or computed expression (e.g. LOWER(email), date_trunc('day', created_at)). Triggered by expressions appearing in WHERE predicates, GROUP BY, ORDER BY, or join conditions.
Why use this?
A plain B-tree on email cannot serve WHERE LOWER(email) = ?. Postgres would have to recompute LOWER for every row and fall back to a sequential scan. An expression index stores the computed result, so the predicate becomes directly indexable. The same applies to date_trunc, casts, JSON path extraction, and any other deterministic expression you filter on repeatedly.
BRIN index
A Block Range Index, proposed for columns used in range predicates.
Why use this?
A BRIN index stores only the min/max value per block range, so it is orders of magnitude smaller than a B-tree on the same column: kilobytes versus gigabytes on a large table. The trade-off is precision. BRIN narrows the search to a range of pages rather than pointing at exact rows, so it shines when data is naturally clustered (time-series, append-only logs, monotonically-increasing IDs) where a B-tree would mostly be wasted.
Hash index
A single-column hash index, suggested for columns used only in equality predicates.
Why use this?
For pure equality lookups (col = ?), a hash index can be smaller than a B-tree and offer constant-time lookup. The win is usually marginal in modern Postgres, so a hash index is only worth considering when the access pattern is strictly equality on a high-cardinality column.
GIN index
Suggested when the workload uses operators typical for JSONB containment, key existence, array operators, or full-text search (@>, <@, &&, ?, ?|, ?&, @@).
Why use this?
A B-tree indexes whole values; it cannot answer "does this JSONB document contain key x?" or "does this array contain element y?" or "does this tsvector match the query?". GIN inverts the structure: it indexes the elements inside each value, so containment, key existence, array overlap, and full-text matching all become fast.
GiST index
Suggested when the workload uses overlap, containment, or full-text operators (@>, <@, &&, @@) on types where ordering is not linear.
Why use this?
GiST is a generalized search tree for types where values do not fit a single linear order, like geometric shapes, ranges, and tsvectors. It excels at "overlap" and "nearest-neighbor" queries (e.g. "find all bounding boxes that intersect this one"), which a B-tree fundamentally cannot answer.
Trigram (GIN + pg_trgm) index
Suggested for fuzzy text matching with LIKE or ILIKE patterns that include leading wildcards. Assumes the pg_trgm extension is installed.
Why use this?
A B-tree can serve a prefix match like LIKE 'foo%', but it is useless for LIKE '%foo%' or LIKE '%foo' because there is no fixed prefix to anchor the scan on. A trigram index slices each string into three-character chunks and indexes those, so any infix or suffix match, including case-insensitive ILIKE, can be served from the index instead of a sequential scan.
Drop
Indexes are not free: every one costs write throughput, disk space, and eventually someone's attention during an incident. DBtune flags indexes that are no longer earning their keep so you can clean them up with confidence:
- An index that backs a constraint (
PRIMARY KEY,UNIQUE,EXCLUSION) is never recommended for removal. Those are structural and DBtune leaves them alone. - Indexes unused for 7+ days are surfaced as informational, in case the index serves a monthly batch job. After 35 days they escalate to a drop candidate, with the bytes you would reclaim shown alongside.
- Indexes whose key columns are already covered by a wider index on the same table are flagged as redundant. The wider index does the same job, so the narrower one is dead weight.
- When DBtune has not been watching long enough to be confident, it says so explicitly rather than suggesting you drop something it has not had a chance to observe.
Index diagnostics
For every index already on your database, DBtune runs a battery of health checks. The checks below are the ones that can be raised on an index; each one comes with the underlying evidence (charts, ratios, timestamps) so you can verify the call yourself rather than taking it on faith.
Unused indexes, no scan usage
The index has not been used at all over the time DBtune has been observing it. If the observation window is short, this is informational; if it has been long enough that the index really should have been hit by something, it escalates and becomes a drop candidate.
Redundant
Another index on the same table already covers everything this one does: same leading columns, same access method, same constraints. The narrower index is dead weight, costing writes and disk for queries the wider index would handle anyway.
Bloat
The index is significantly larger on disk than its data structurally warrants. Bloated B-trees waste cache, slow down scans, and quietly consume storage; rebuilding (REINDEX CONCURRENTLY) reclaims the space.
Low cache hit rate
The index is being read from disk more often than from PostgreSQL's buffer cache. That usually means the working set has outgrown shared buffers, or the index is too cold to stay resident. Either way, lookups are paying I/O latency they should not be.
Underused
The index does get used, but only rarely compared to other access paths on the same table. Worth a closer look: it might be specialized for a query that is no longer hot, or it might be losing out to a better index that already exists.
Declining usage
The index's scan rate is trending down over time. Often an early signal that a query has been rewritten, a feature has been deprecated, or a workload has shifted, and the index is on its way to becoming unused.
Low correlation
The leading indexed column does not match the physical order of the heap. Range scans on this index end up jumping around the disk instead of reading sequentially, which kills throughput. Sometimes a sign that a CLUSTER or a different index choice would help.
Invalid index
The index exists but is marked invalid, typically the leftover of a CREATE INDEX CONCURRENTLY that failed partway through. The planner ignores it, but every write still maintains it. Almost always safe to drop and recreate.